


Because of disk space limitation, a
three-dimensional data set with
only  cells (
 points)
was generated by using an FEM software package called
ABAQUS. This data came from a stress analysis that was performed on a machine component.
In FEM analysis, usually the stress distributions
and the deformation under certain loading conditions are more important.
Those two graphs will tell the designers how strong and stiff the component is
and how materials can be reasonably distributed,
and thus will help them to optimize the
design.
This new algorithm was used on this data set for rendering the stress
distribution graph. The volume rendering job was done on an SGI workstation
with a MIPS R8000 CPU, MIPS R8010 FPU, and 128-megabyte memory, running the Irix 6.2
operating system.
The whole process took less than 10 minutes to get a
points)
was generated by using an FEM software package called
ABAQUS. This data came from a stress analysis that was performed on a machine component.
In FEM analysis, usually the stress distributions
and the deformation under certain loading conditions are more important.
Those two graphs will tell the designers how strong and stiff the component is
and how materials can be reasonably distributed,
and thus will help them to optimize the
design.
This new algorithm was used on this data set for rendering the stress
distribution graph. The volume rendering job was done on an SGI workstation
with a MIPS R8000 CPU, MIPS R8010 FPU, and 128-megabyte memory, running the Irix 6.2
operating system.
The whole process took less than 10 minutes to get a  image. The image
is shown in Figure 3.
image. The image
is shown in Figure 3. 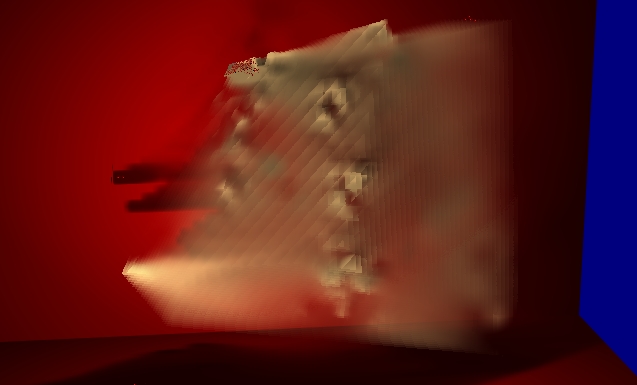
Figure 3: Stress distribution from volume rendering
The result clearly shows the stress concentration (or high stress) areas, which are very close to the outputs from the FEM software. The stress distribution is very reasonable. The further away a point's position is from the point of action of the force, the less the effect of the applied force at that point. The major advantage of this result over FEM output is that this result can clearly show the inside of a volume. FEM output only shows either the outermost layer of the volume or any specified isosurface, because it uses ordinary graphics techniques, not volume rendering. FEM output can not show the inside detail.