Alark Joshi, Jesus Caban, Penny Rheingans and Lynn Sparling
Abstract:
The devastating power of hurricanes was evident during the 2005 hurricane season, the most active season on record. This has prompted increased efforts by researchers to understand the physical processes that underlie the genesis, intensification, and tracks of hurricanes. Intensity change, in particular, is poorly understood at present and current numerical weather prediction (NWP) models are unable to accurately predict when a hurricane will intensify or weaken.
This research aims at providing an increased understanding into the structure of hurricanes with the aid of visualization techniques. To better understand these systems, and to explore their representation in NWP models, we use a variety of techniques to visualize their structure and time evolution. In particular, understanding the change in attribute values, when a hurricane changes its category, is critical in order to develop an understanding of the physics behind intensity change. Visualization of the evolution of structural features is a prelude to a deeper visual analysis of the underlying dynamics.
Using techniques inspired from the field of illustration, we generate visualizations that facilitate exploration of internal structural details, and visualization of mesovortex formation over time. In order to facilitate the understanding of the temporal nature of the data, we create expressive visualizations that convey change in values over a time interval.
Illustration-inspired techniques led to the identification of the amount of a vertical wind shear in a hurricane. Vertical wind shear can cause rapid hurricane dissipation and its identification can help meteorologists predict dissipation. Additionally, mesovortices thought to play a role in the dissipation process can clearly be seen and investigated using these illustration-inspired techniques. Illustration-style visualization, in combination with standard visualization techniques, helped investigate the vortex rollup phenomena and the mesovortices contained within. We evaluated the effectiveness of our visualization with the help of six hurricane experts. The expert evaluation showed that the illustration-inspired techniques were found to be more effective and were preferred over their existing tools.
Visualizations:
Visualizing the cloud water attribute in hurricane Katrina
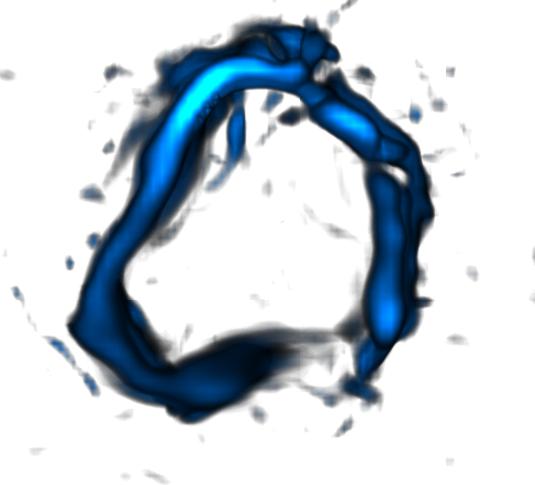
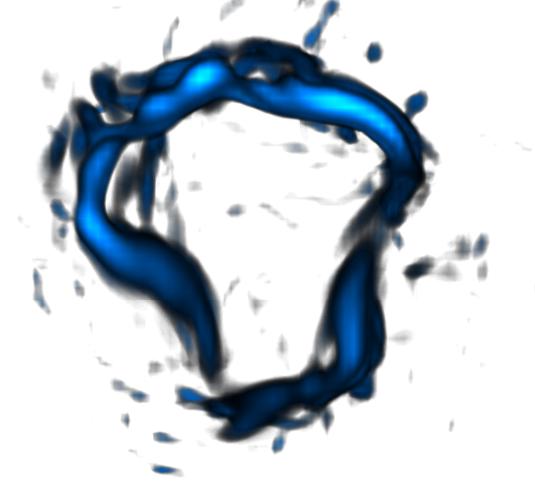
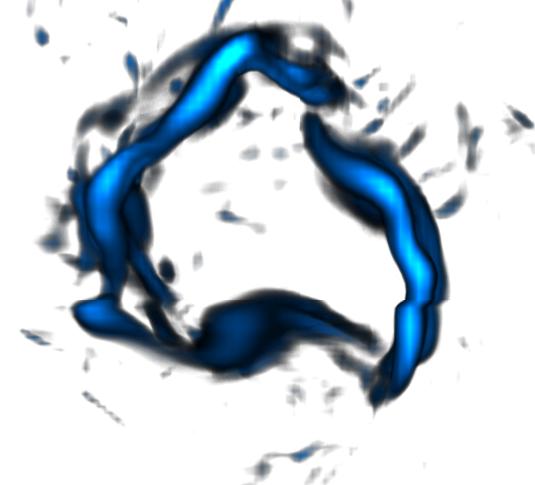
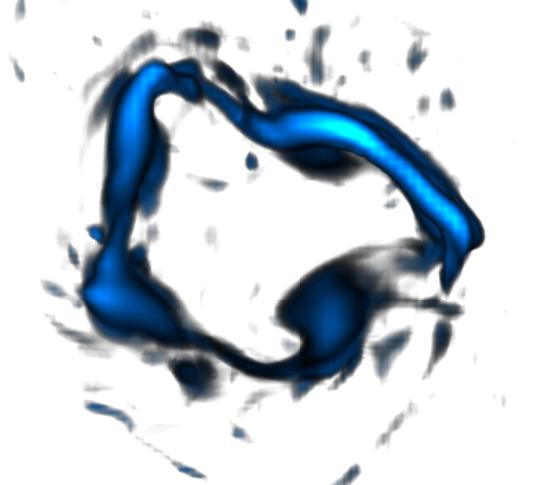
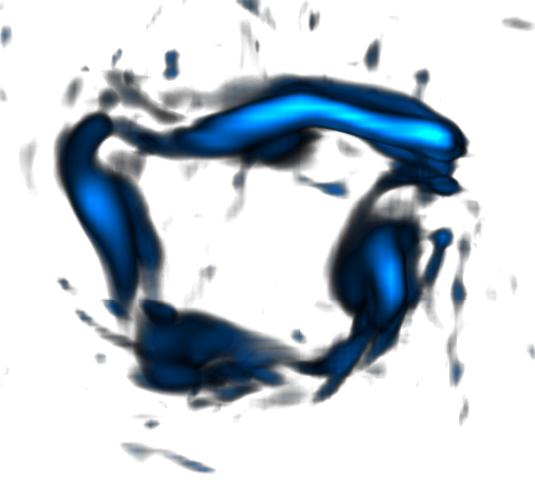
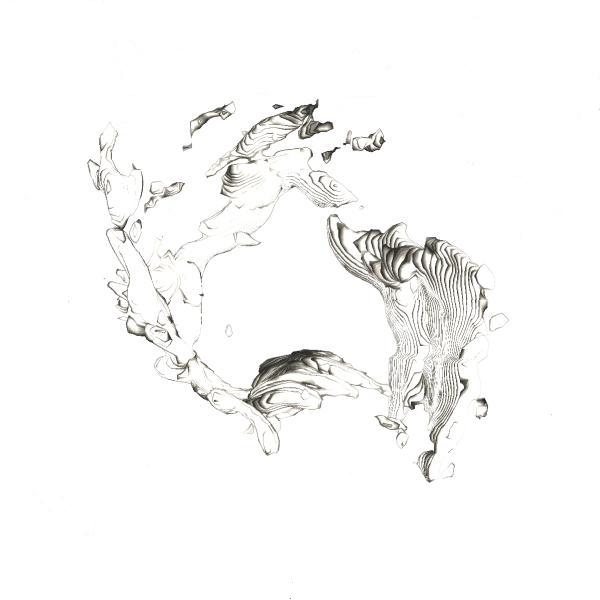
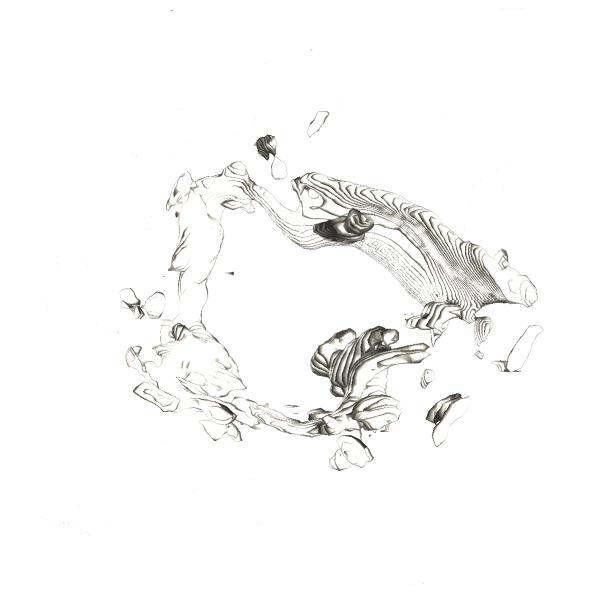
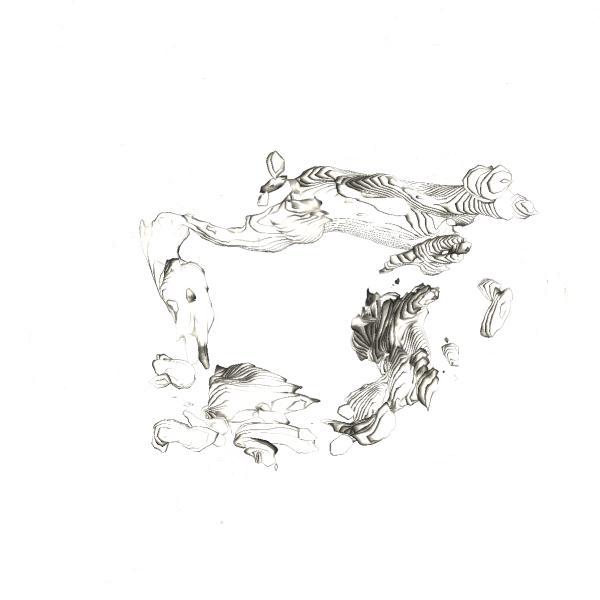
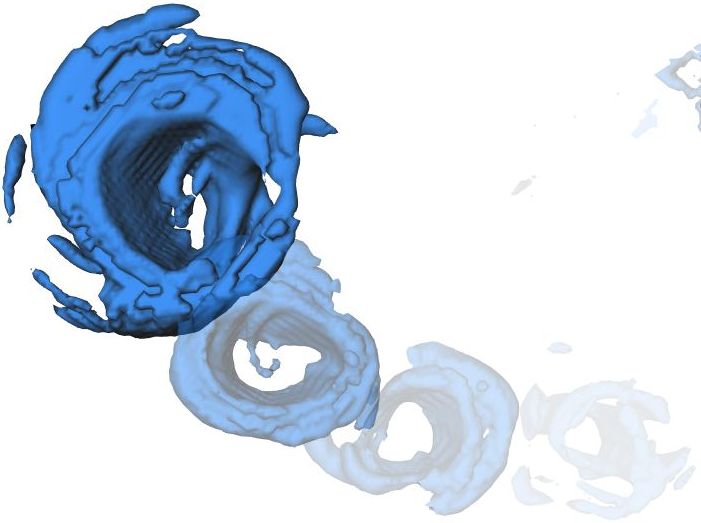
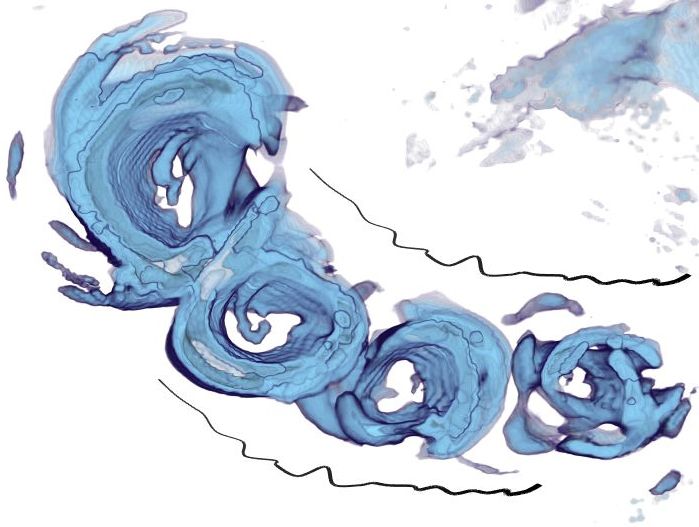
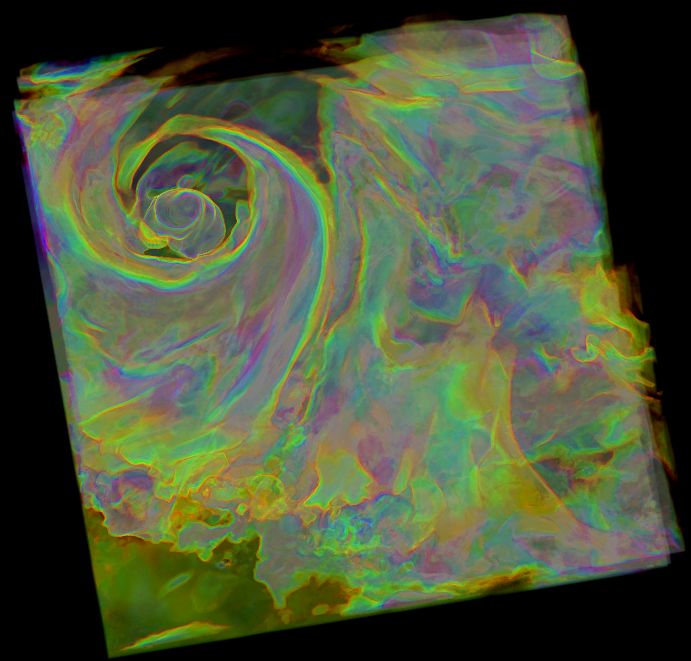
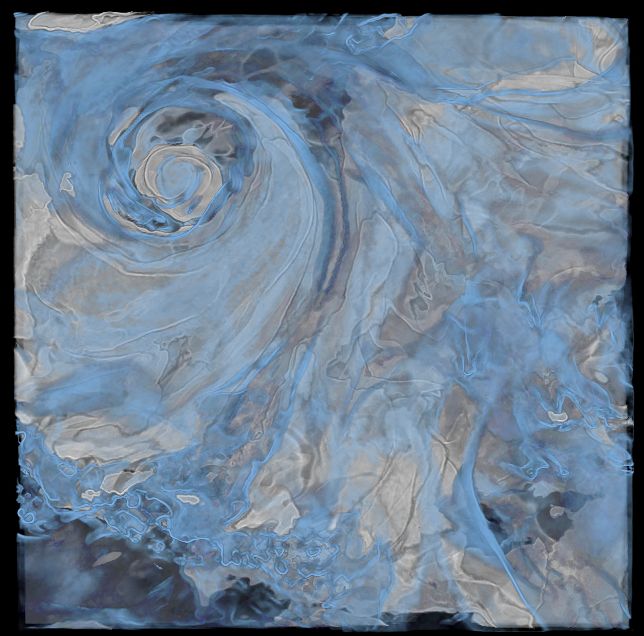
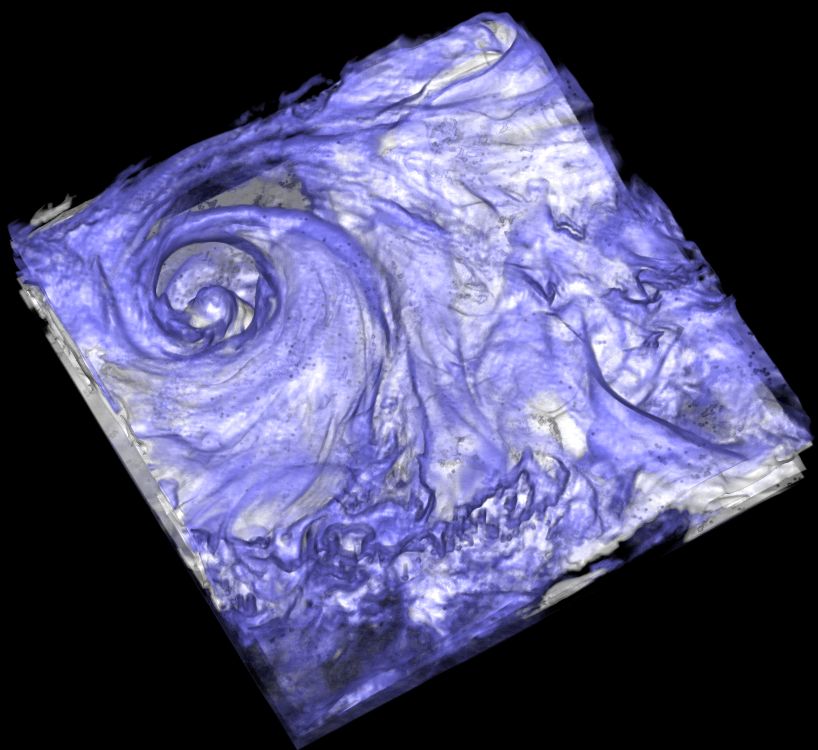
Vorticity field in Hurricane Bonnie - Volume rendering compared to illustrative visualization
Conveying the time-varying nature of a hurricane
Visualization in which older faded footprints represent time instants when the hurricane changed its category.
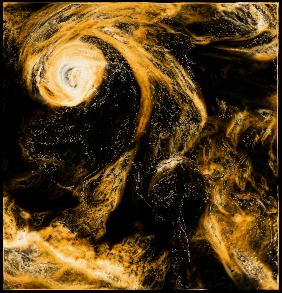
Hurricane Katrina - Cloud water visualization annotated with speedlines
Humidity visualization of timestep 71 in hurricane Katrina
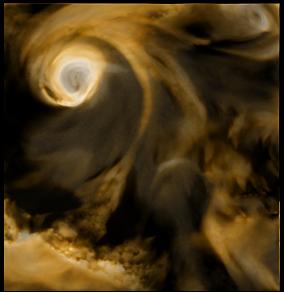
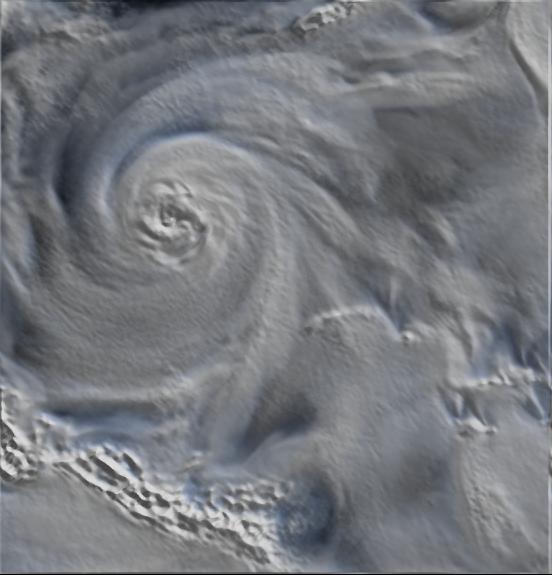 Original volume rendered image with lighting of the humidity attribute in Hurricane Katrina. The eye of the hurricane can be seen in the top left region of the image. The rainbands, which are spiral structures emanating from the eye too can be seen. |
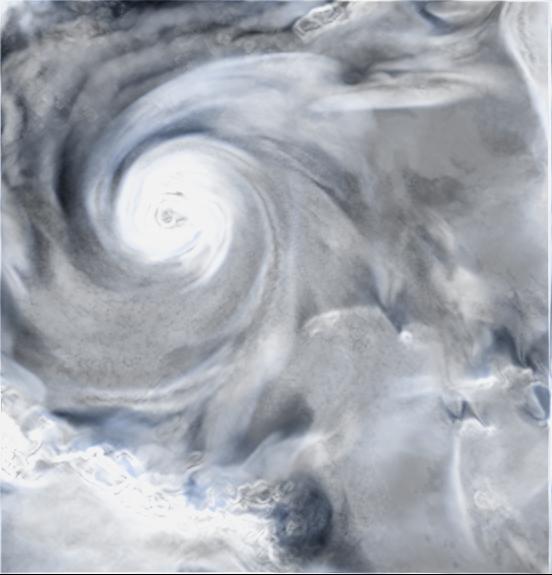 This image depicts a visualization generated using the boundary enhancement technique of the humidity attribute. In this image, the eyewall of the hurricane too is visible along with the eye. The eyewall is well-defined and implies that the hurricane is a category 4 hurricane in this timestep. The rainbands too are more well defined. |
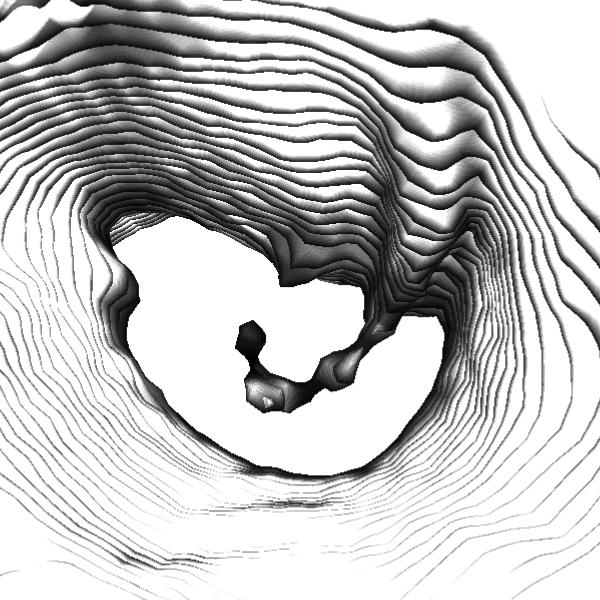
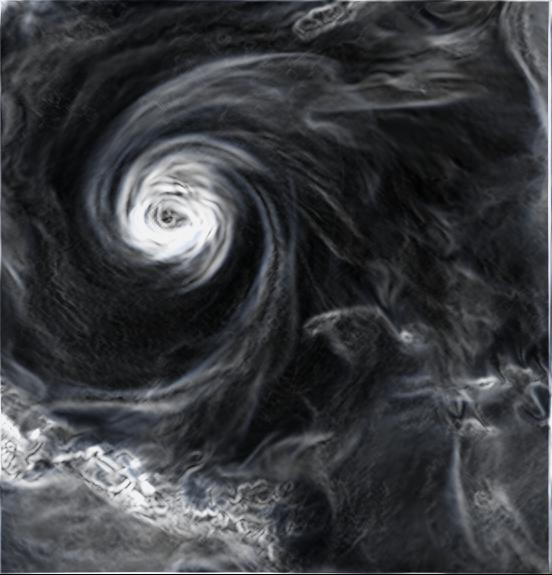 In this image a visualization generated using silhouette enhancement technique clearly shows the eye, the eyewall and the rainbands. These "interesting" features are preserved and accentuated while the other uninteresting regions are eliminated. |
 Volume rendering of the humidity attribute in the 71st timestep of hurricane Katrina. |
 Boundary enhanced version. |
 Boundary and Silhouette enhanced. |
Visualizing the cloud water attribute in hurricane Katrina
Multidimensional transfer functions 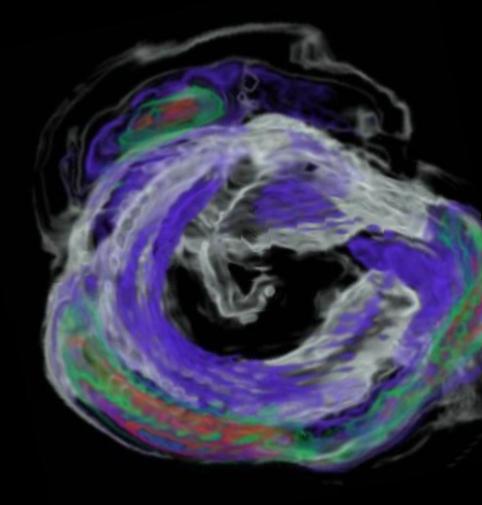
|
Illustration-inspired technique in a pen-and-ink style 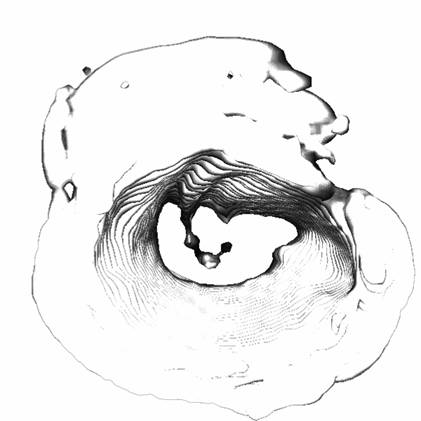
|
Vorticity field in Hurricane Bonnie - Volume rendering compared to illustrative visualization
| Timestep 13 | Timestep 20 | Timestep 26 | Timestep 30 | Timestep 33 |
|
|
|
|
|

|

|
|
|
|
|
Video of all the 120 timesteps of Vorticity - Volume Rendered |
Illustrative visualization of Vorticity video |
Conveying the time-varying nature of a hurricane
 Opacity-based techniques conveying change in the hurricane over time. Hurricane footprints from timestep 10, 35, 53, 71 are shown here. Older timesteps are represented in a faded manner to provide context. |
 Speedlines and opacity based techniques are combined to produce an expressive visualization that conveys change over time. The evolution and growth of a hurricane can be conveyed through this image. |
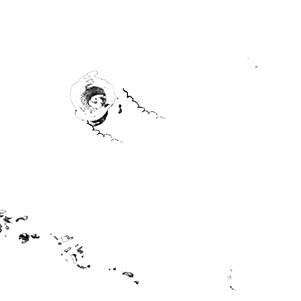
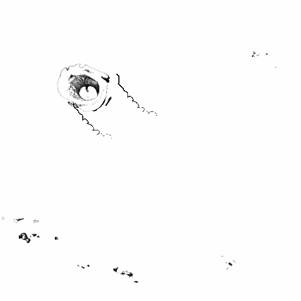
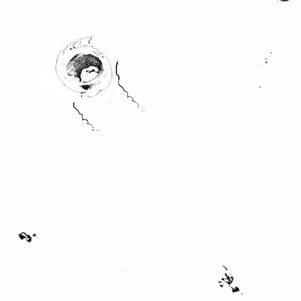
Visualization in which older faded footprints represent time instants when the hurricane changed its category.
Opacity-based visualization with a footprint for every instant that the hurricane changes its category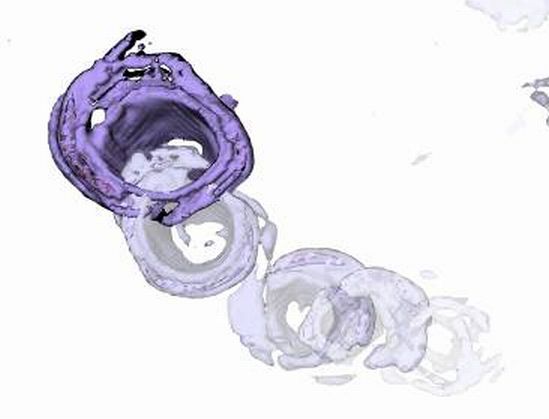
|
Video showing footprints of timesteps when the hurricane changes its category |
Hurricane Katrina - Cloud water visualization annotated with speedlines
 Timestep 52 |
 Timestep 58 |
 Timestep 64 |
 Timestep 71 |
Humidity visualization of timestep 71 in hurricane Katrina
|